In the first part of this article, we set the scene by explaining how to measure success of active managers. In this part of the article, we will be looking at our findings.
Success Rates versus Asset-Weighted Return Differences
Despite the differences between these two measures of success, the predictions from Dunn’s Law using asset-weighted return differences compared with success rate largely line up. As a refresher, we built a regression model to explain the variation in active managers’ success rates within each category over time. For the nine U.S. equity categories, the explanatory variables in the model included the returns to market risk, small size, value, and international stocks relative to U.S. stocks. We calculated each of these explanatory variables (or factors) using an index return spread.
The regression analysis measures how closely the variation in active managers’ success rates is linked to the payoff of potential style differences between active and index managers. For example, if active managers in the large-value Morningstar Category have greater exposure to mid-cap value stocks than their index peers, their success rates should improve when smaller stocks beat larger stocks. The regression would detect that relationship.
While this model should pick up variations in success rates that arise from differences in exposure to small size, value, market risk, and international stocks, it doesn’t capture other ways in which active funds differ from their index peers. These include differences in stock selection and sector exposure unrelated to these factors, which may limit its explanatory power.
I used this same model in attempt to explain the variations in asset-weighted return differences between actively and passively managed funds. Exhibit 2 below shows the three- and five-year measurement periods for the nine U.S. equity Morningstar Categories.
Exhibit 2: Regression Results from Success Rates and Asset-Weighted Return Differences
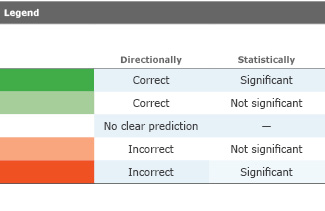
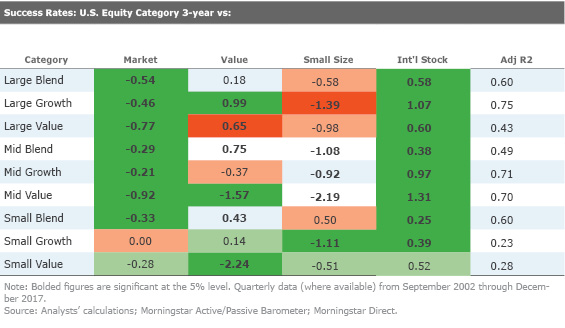
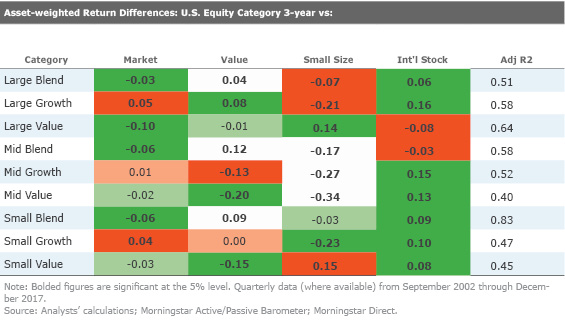
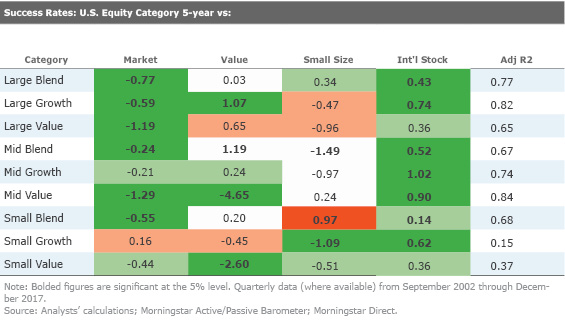
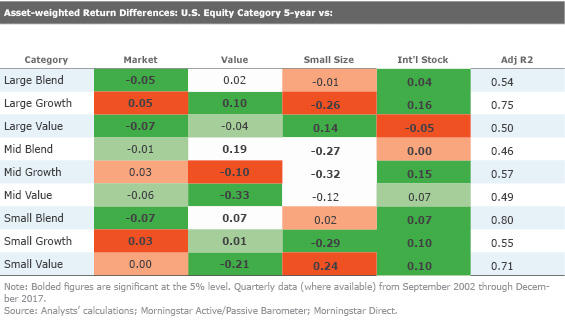
The results largely line up with the original analysis, but there are a few differences. In the original study, the two most consistent indicators of success rates—market returns and international stock exposure—have less consistent explanatory power across categories when attempting to explain the variation of asset-weighted return differences. For example, we expect active U.S. equity funds to outperform their index peers when international stocks perform better than U.S. stocks because the average active fund likely has more exposure to non-U.S. stocks than U.S. index funds. This relationship held across all nine categories in the original study but didn’t hold for large-value or mid-blend when using asset-weighted returns.
In the original study, the U.S. market return had a negative relationship with the success rates in every category except for small-growth. In this updated study, the relationship doesn’t hold for large-, mid-, and small-growth or small value. On the other hand, the adjusted R-squared values of the model were more stable across Morningstar Categories for the asset-weighted return differences than the success rates.
When to Invest in Passive or Active Funds?
It’s difficult to fully explain why the average active fund in a given category outperforms its passively managed peers for a given measurement period. Stylistic differences between active and passive managers contribute to the variation in active managers’ performance, but they don’t tell the whole story and the results don’t always line up with the predictions of Dunn’s Law. The average of any large sample is noisy and it’s hard to distill success into one data point for an entire category.
The most important takeaway is that it’s not advisable to attempt to time exposure between index and active managers because this is like timing just about anything else in the market—it’s hard to do successfully. Instead, investors should focus on the aspects of investing that they can control, such as:
- Set an appropriate asset allocation.
- Don’t overpay for investment management.
- Don’t place too much weight on short-term performance.


.png)


