


Do you remember what risk feels like? While the market has hit a pothole or two during the current bull run, the ride has generally been smooth. Many--myself included--probably have a hard time remembering just how nerve-wracking the last bear market was.
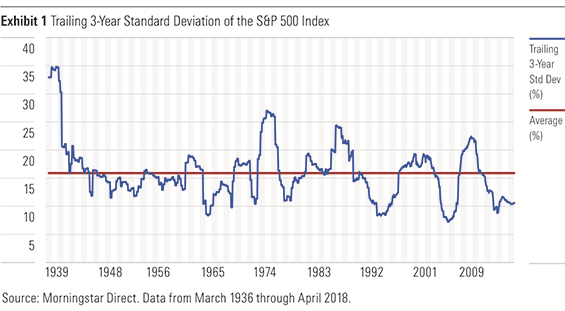
Below, I've included a plot of the trailing three-year standard deviation of the S&P 500 from March 1939 through the end of April 2018. At present, this measure of stock market volatility has been trending below its long-term average for 68 months. This marks the third-longest stretch of below-average volatility for the index dating back to 1939. The next-longest period lasted 75 months, from March 1956 through May 1962. So the current streak is unprecedented in the experience of most investors.
Are you ready for when volatility rears its ugly head again? Here, I'll help you get reacquainted with risk: defining it and discussing how it's measured, how investors experience it, and how they can try to manage it.
What Is Risk?
The most common definitions of investment risk are rooted in uncertainty. How likely is it that the returns on an investment will deviate from their expected returns, and by how much? There are a variety of ways to measure this likelihood, the most common of which I mentioned earlier: the standard deviation of returns. This figure helps investors understand how widely returns may fluctuate around their average. It is a metric that is simple, widely accepted … and deeply unsatisfying.
Standard deviation falls short in a number of ways. It treats downside risk (the bad kind) and upside risk (the good kind) as equals. Also, it ignores the "tails" in the distribution of returns: those episodes that result in the greatest euphoria or most acute gut-rot. Of course, there are other risk measures that address these shortcomings.
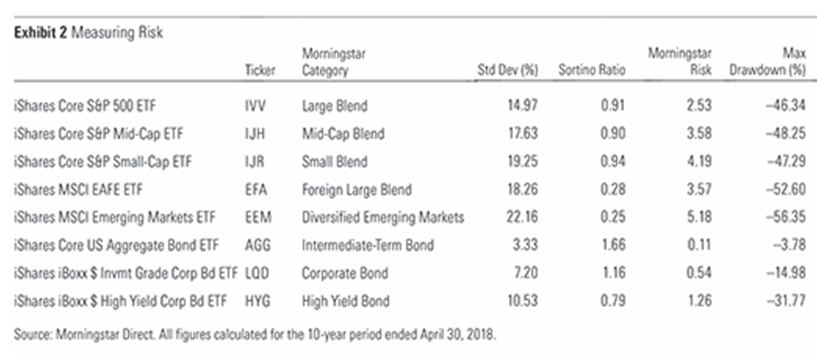
Measures that differentiate between good and bad volatility include the Sortino ratio and Morningstar Risk. The Sortino ratio is a variant of the Sharpe ratio, the most commonplace measure of risk-adjusted returns. Both ratios include excess returns over the risk-free rate in the numerator. But while the Sharpe ratio features standard deviation in the denominator (which, again, treats good and bad risk as equals), the Sortino ratio divides only by downside deviation. This gives a more accurate picture of an investment's return per unit of "bad" risk. Morningstar Risk looks at risk exclusively. It doesn't ignore good risk entirely, but instead places greater emphasis on bad risk. This measure--which is calculated relative to funds' Morningstar Category peers--is baked into the Morningstar Risk-Adjusted Returns that are the basis of the Morningstar Rating for funds. While both these measures differentiate between good and bad risk, they still don't capture the worst of the worst.
The most common way to size the sting in the left tail of the distribution of returns (the bad one) is maximum drawdown. Maximum drawdown captures the peak-to-trough decline of an investment over a given period. While not a worst-case scenario (that would be losing everything), it can provide a sense of just how much pain might be in store in a bear market.
While all of these measures of risk have some degree of utility when it comes to framing investors' expectations, I think they're still inadequate. I don't believe that risk can be properly measured in a spreadsheet.
What Is the Real Risk?
In my opinion, the real risk lies in how we respond to the ups and downs in the market. The volatility that the above numbers attempt to explain is the net result of the actions of flesh-and-blood human beings. We are all responding to signals from our environment (that is, one another). These signals are being generated and interpreted by a hunk of gray matter that is wired for survival. We are risk-averse beings by nature. The real risk is that we do the wrong thing at the wrong time and put ourselves off the course toward reaching our goals. It's impossible to convey that with data.
In part 2 of this article, we will discuss how to manage risk.


.png)


