


Diversification is the only free lunch in investing. Spreading bets across securities, sectors, and geographies is an efficient way to reduce risk. But traditional means of measuring these dimensions of diversification have limitations.
Take Amazon.com (AMZN) for example. The online retail giant belongs to the Internet and direct marketing retail subindustry within the consumer discretionary sector in the Global Industry Classification System. But in the second quarter of 2019, nearly 12% of its sales and just over half its operating income came from Amazon Web Services, its cloud computing offering. And though the company is domiciled and listed in the United States, 28% of its second-quarter 2019 sales came from its international division. Clearly, Amazon is more than a U.S. consumer discretionary firm.
As global markets have evolved, the tools that investors use to understand them have, too. In this article, I'll take a closer look at one enhancement to this tool kit: Morningstar's Revenue Exposure by Region data.
Revenue Exposure by Region
Borders have become more porous and companies' economic footprints more global. Categorizing firms based on their domicile or where their stock is listed often gives little insight into the factors that matter most to their fundamentals. Morningstar's Revenue Exposure by Region data provides a fuller picture of where firms are doing business.
This data is sourced directly from public companies' filings. Most provide some level of detail in their regular reporting to investors on where their sales and profits are coming from and where their assets are located. However, reporting conventions are inconsistent across companies. For example, Apple (AAPL) reports revenues across five separate geographies (Americas, Europe, Greater China, Japan, Rest of Asia Pacific), while Samsung Electronics (SSNLF) provides no geographic breakdown of its consolidated sales in its filings. To address these discrepancies, we have developed a framework for attributing company revenue to individual countries and then assigning them to a standard list of Morningstar-defined regions. This facilitates comparisons across companies and allows us to roll the data up at the portfolio level to better understand the geographic origins of the combined sales of stocks within a fund.
Putting It to Use
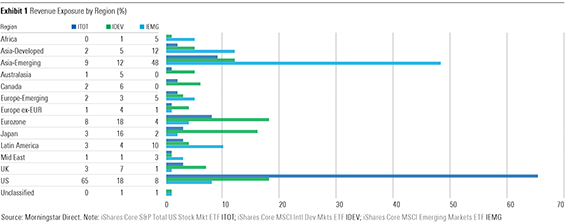
Looking at exchange-traded funds underpinned by broad-based market-cap-weighted indexes through this lens yields interesting results, as Exhibit 1 shows. The data speak to the global footprint of the companies that make up these funds' portfolios. In the case of iShares Core S&P Total U.S. Stock Market ETF (ITOT), just more than a third of this U.S.-stock portfolio's revenue comes from outside the U.S. Just shy of 40% of the combined sales of companies included in iShares Core MSCI Emerging Markets ETF (IEMG) is made in developed markets.
Drilling down further from broad-based cap-weighted ETFs, new patterns emerge. Splitting U.S., developed ex U.S., and emerging markets based on market cap shows that regional revenue exposures shift along the market-cap ladder. In both the U.S. and developed ex U.S. markets, small-cap stocks sell more in their home markets than their large-cap counterparts, as shown in Exhibit 2. Much of this difference can be explained by differences in sector composition. Also, smaller companies might not yet need to focus as much on foreign markets to fuel their growth.
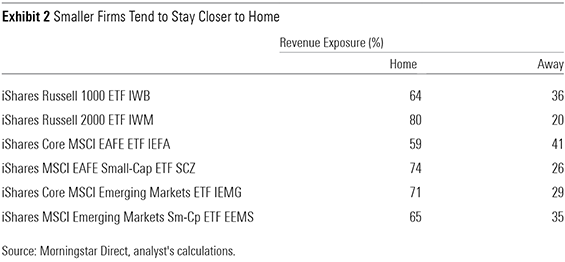
The relationship is reversed in the case of emerging markets. Differences in sector exposure between IEMG and its small-cap carve-out iShares MSCI Emerging Markets Small-Cap ETF EEMS explain this. IEMG has far greater exposure to financials than EEMS (23% versus 10%). These stocks derive most of their revenue in their local markets. EEMS also has greater exposure to export-oriented sectors like industrials (14% versus 6%) and materials (12% versus 8%).
In part 2, we will continue to explore diversification in other lenses.


.png)


