If I had a nickel for every time I’ve heard someone say that market-cap weighting is a momentum strategy because investors in cap-weighted index funds “buy more of the biggest stocks as their price goes up,” I’d be writing a FIRE (Financially Independent Retire Early) lifestyle blog right now. Alas.
This argument has curb appeal. But is it right? Are investors in cap-weighted index funds just riding momentum?
Just the Market
At the risk of oversimplifying, the market is...well, the market. A market-cap-weighted index fund that captures a significant majority of the investable market cap of its target market, such as Vanguard Total Stock Market ETF (VTI, listed in the U.S.), has no inherent biases. It captures virtually every U.S.-listed stock and weights them based on their free-float-adjusted market cap. Its movements are driven by investors’ collective opinion of the worth of its constituents. Sometimes we, as a group, get the price “right”—for a fleeting moment. More often, we get it wrong—as markets spend most of their time on one side or another of fair value, though it’s hard to recognize where prices are relative to that mark in real time.
The claim that market-cap weighting is a momentum strategy gathers steam as markets rally. Ten-plus years into the current bull market, it has a full head of steam. Proponents point to rising levels of concentration within cap-weighted indexes and the degree to which a small handful of sectors and names have driven the market’s gains as evidence.
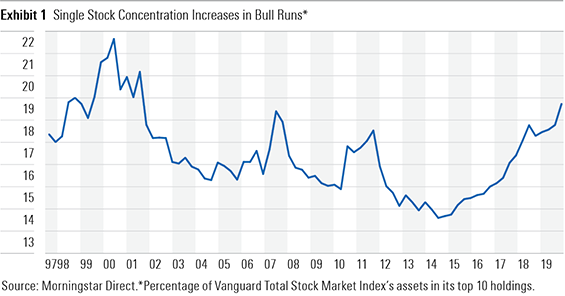
Exhibit 1 shows the percentage of total assets in Vanguard Total Stock Market Index (VITSX, available in the U.S.) that was invested in its top 10 holdings from the time the fund’s Institutional share class incepted in September 1997 through the end of 2019. The level of portfolio concentration for this cap-weighted index fund clearly ebbs and flows with the market’s performance. The amount of assets invested in the fund’s top 10 holdings has averaged roughly 16.5% since the Institutional share class’ inception. It peaked just shy of 22% (nearly 3 standard deviations above its since-inception average) at the height of the tech bubble and most recently clocked in at nearly 19% (1.25 standard deviations higher than its since-inception average).

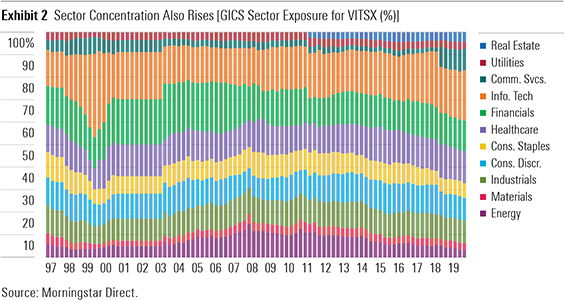
Exhibit 2 measures portfolio concentration through the lens of GICS sector exposure. It shows the evolution of the Vanguard fund’s sector allocations since 1997. At the height of the tech bubble, the fund had nearly 37% of its assets in tech stocks. In the runup to the global financial crisis, its allocations to financials and energy stocks both crested. The subsequent wreckage experienced in each of these sectors is pointed to as further evidence of cap-weighted indexes’ momentum-following tendencies.

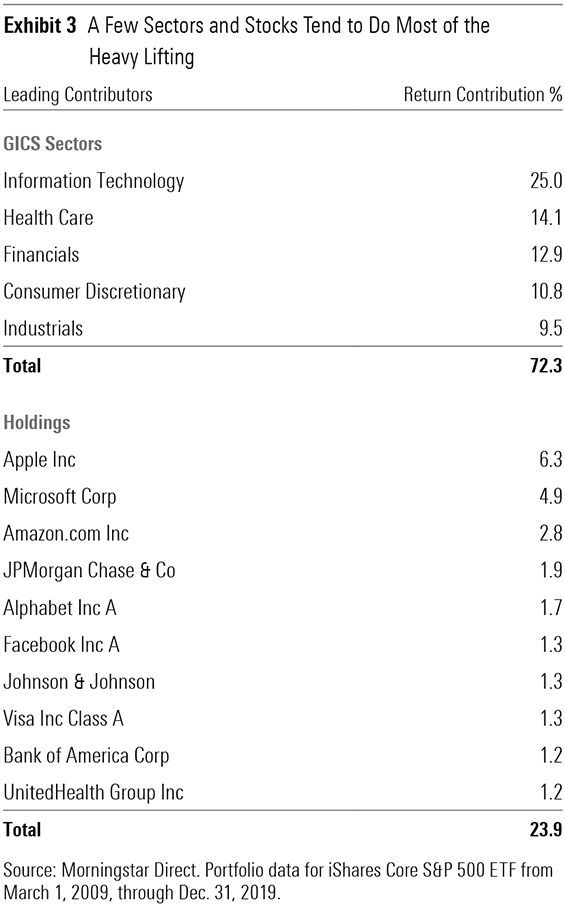
Exhibit 3 provides a more granular example of how just a handful of sectors and stocks tend to do most of the heavy lifting in bull markets. The table shows the percentage contribution to the post-financial-crisis performance of iShares Core S&P 500 ETF (IVV, listed in the U.S.) from the top five GICS sectors and top 10 stocks. The tech sector accounted for one fourth of the fund’s gains from March 2009 through the end of 2019, and Apple (AAPL) alone represented 6.3% of a decade-plus worth of returns.

Is this an open-and-shut case for the “cap weighting is a momentum strategy” crowd? The facts are the facts. As bull markets run, cap-weighted indexes tend to become more concentrated in a handful of sectors and stocks. These same sectors and stocks tend to account for a disproportionate amount of the market’s gains. But these are features of market-cap weighting, not bugs. And they’re certainly not indisputable evidence that market-cap weighting is a momentum strategy—at least not in the traditional sense.
In part 2 of this article, we will explore “momentum” further.


.png)


