


Low-volatility exchange-traded funds aim to give investors a smoother ride in stock markets. Being long stocks with less risk is a compelling proposition. So it's little surprise that these funds have been popular. Over the three years through February 2020, investors poured a combined $23.8 billion of their hard-earned savings into the eight U.S. large-cap ETFs listed in the U.S. that focus on dialing down volatility. This represented 125% organic growth over that three-year stretch. But the recent market meltdown has put these funds to the test, and some investors have gotten spooked. These funds saw $1.9 billion in net outflows in March.
Here, I'll look at how low-volatility ETFs have performed in the market downdraft, examine the differences among them, and share my thoughts on how investors might use them to manage risk.
The Best of One World
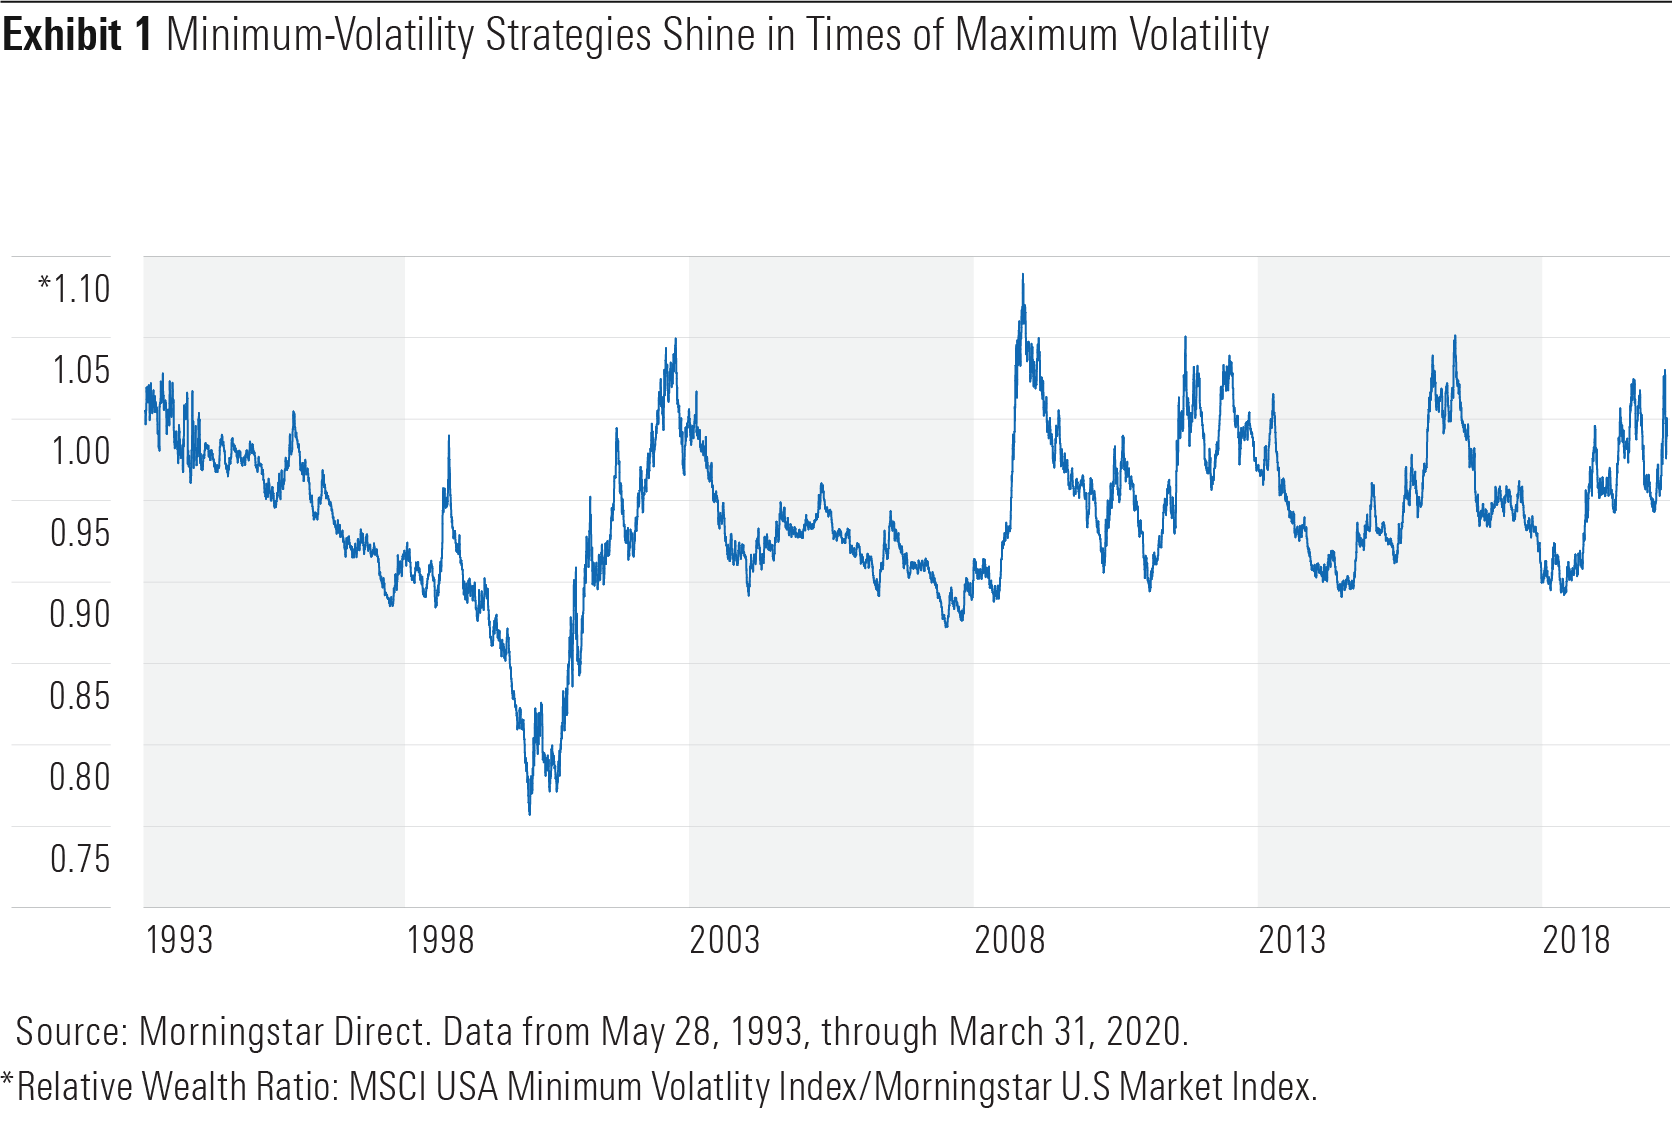
Low-volatility strategies are at their best when markets are at their worst. Exhibit 1 is a relative wealth chart that plots the growth of the MSCI USA Minimum Volatility Index divided by the growth of the Morningstar U.S. Market Index. When the line slopes upward, the minimum-volatility index is outperforming the broad market index and vice versa. The upward spikes coinciding with the bursting of the dot-com bubble, the global financial crisis, and the current coronavirus pandemic are a testament to the strategy's efficacy--it has taken some of the sting out of stock market drawdowns.
But there are trade-offs. Investors can't have the best of both worlds. Low-volatility strategies will tend to lag during bull markets. This is most evident in the sharp downward slope of the line that spans the better part of the 1990s.
Over the long term, investors in low-volatility strategies are betting that this trade-off between losing less on the downside and not gaining as much on the upside will result in marketlike returns with less risk. The nearly three decades of performance history illustrated in Exhibit 1 show that has generally been a solid bet--over a long enough horizon.
Weathering the Storm
How have low-volatility ETFs weathered the recent storm? In a word: differently. Let’s take a look at two of the eight U.S. large-cap low-volatility ETFs listed in the U.S., namely the Invesco S&P 500 Low Volatility ETF (SPLV), and the iShares Edge MSCI USA Minimum Volatility ETF (USMV) as examples.
During the recent sell-off, USMV's maximum drawdown (the depth of its decline from its mid-February peak) was 33.1%. SPLV's maximum drawdown was 36.3%. iShares Core S&P Total U.S. Stock Market ETF (ITOT)--a proxy for the broader U.S. market--experienced a maximum drawdown of 35.0%. USMV performed as expected during this episode; SPLV did not. Investors should not expect these funds to bat 1.000, outperforming the market each time it dips. The longer the time frame, the more likely it is you'll see this relationship hold. In fact, as of the end of March, both funds had outperformed ITOT on a year-to-date basis, posting more-modest losses.
This underscores two key points that investors must keep in mind when assessing the merits of these funds and deciding where they might fit within their portfolios: 1) Results may vary from fund to fund. 2) Low volatility does not mean no volatility, just less.
In part 2 of this article, we will examine the differences among the different volatility ETFs.


.png)


