Market-cap-weighted indexes, and low-cost funds that track them, have historically proven tough to beat in some markets. But tough shouldn’t be interpreted as impossible. As it turns out, many strategies that follow simple rules have fared better. And they don’t possess a magical source of alpha. Rather, their outperformance comes from a few well-known factors.
A Paradox?
Market efficiency is often cited as a big reason why market-cap-weighted indexes, and low-cost funds that track them, are so notoriously difficult to beat. Any stock’s price, and its corresponding weight, should incorporate all known information--including its current value and expected return--limiting the chance that anyone can gain an advantage.
If the market efficiently prices stocks, then it seems reasonable to expect that other weighting approaches should underperform, as they are ignoring the crowd’s collective wisdom. But reality doesn’t fully reflect that theory.
Paradoxically, many strategies that ignore price and employ simple alternative rules to weight stocks have historically fared better than the market. For example, the S&P 500 Equal Weight Index ignores market prices by assigning the same 0.2% weight to every constituent in the market-cap-weighted S&P 500.
Exhibit 1 shows that its performance relative to the cap-weighted index has been nothing short of impressive, with total and risk-adjusted returns both outperforming over the prior five decades. Each index held stock in the same 500 companies, so the performance gap was directly caused by the different weighting schemes. But why?

Factors Hidden in Plain Sight
To answer that question, let’s take a closer look at the equal weight index. By design, it shifts assets away from the largest companies and allocates the difference to smaller names. For example, Apple (AAPL)--the largest S&P 500 component--commanded 4.58% of the cap-weighted benchmark on Dec. 31, 2019, while Garmin (GRMN) represented only 0.07%. By comparison, the equal-weight strategy assigns the same 0.2% weight to both.
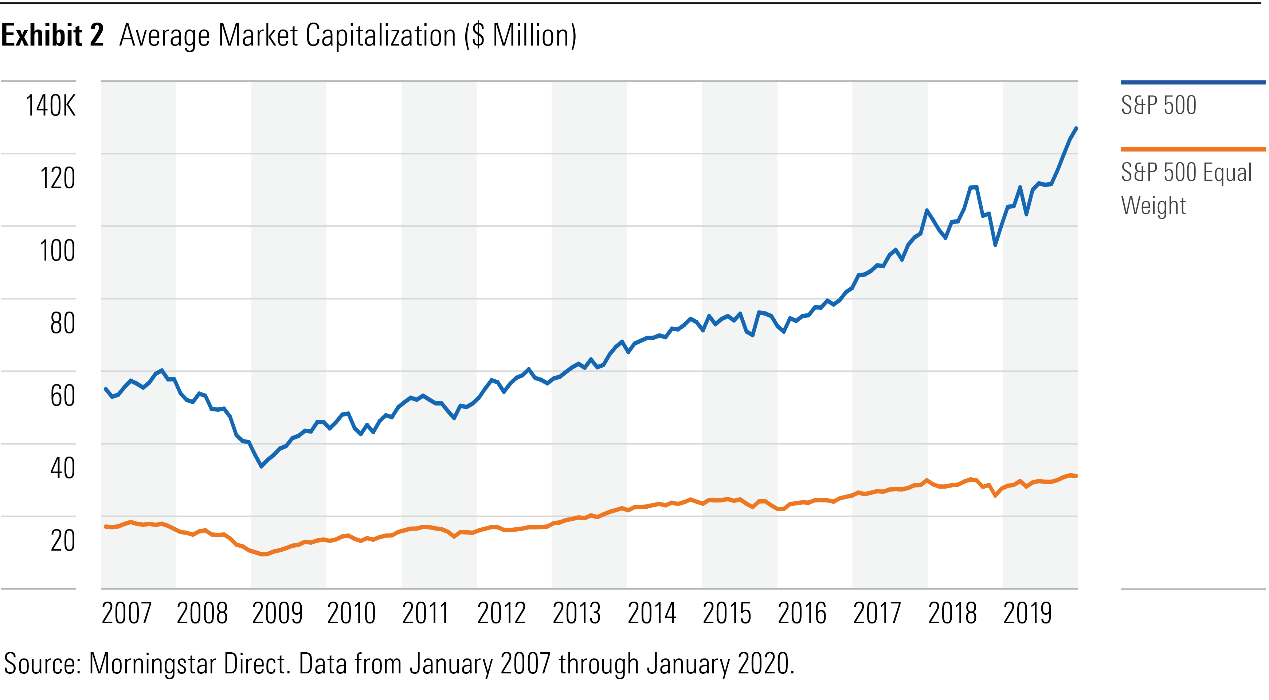
The average market capitalization of the equal weight index reflects its preference for stocks with smaller market capitalizations. Exhibit 2 shows that over the past 13 years (since data was available), the average market capitalization of the S&P 500 Equal Weight Index has been roughly one fourth that of the cap-weighted index.

Rebalancing an equal-weight index also injects a mild value tilt into the portfolio. In order to maintain its desired weights, the strategy will sell shares that have appreciated relative to their target weight and use the proceeds to buy those that have declined since the previous rebalance.
By assigning the same weight to each constituent, the equal weight index is simply tilting toward stocks with smaller market capitalizations and lower valuations, which have historically outperformed their larger and more expensive counterparts. Why they’ve outperformed is up for debate. This could just be compensation for risk, in which case, the strong performance of the equal weight index is doesn’t necessarily conflict with the theory of market efficiency. However, it’s also possible that the success of the small size and value factors is partially due to mispricing.
In any case, the results of a three-factor regression in Exhibit 3 verify that these factor exposures largely explain the outperformance of the equal-weight strategy. The small-cap and value coefficients were both statistically significant, while alpha was essentially zero. There is nothing special about equal weighting after controlling for its style tilts.

In Part 2 of this article, we will continue to look into the S&P 500 Equal Weight Index and explore beyond factors.


.png)


