


In part 1 of this article, we looked at the landscape of Asia Strategic-Beta ETPs as of June 2020. In this part of the article, we will continue to explore the performances in more details.
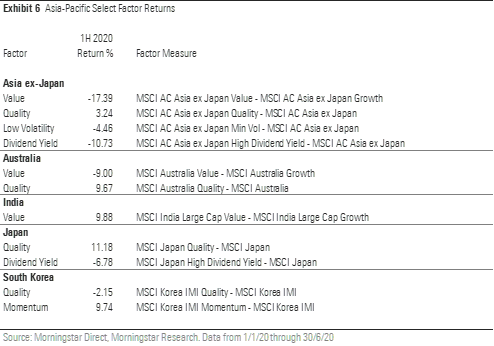
Looking at these products' recent performance through the lens of strategic-beta groups reveals more detail. In the first half of 2020, only the growth and momentum strategic-beta groups scored success rates (the number of strategic-beta ETPs outperforming their respective category indexes) of greater than 50%. This could be explained by their relative factor performances during the same period. Similarly, the low success rates in the other strategic-beta groups could largely be explained by the performance of their corresponding factors. For example, as shown in Exhibit 6, the MSCI AC Asia ex Japan High Dividend Yield Index underperformed the parent index by 10.7%. The success rate among funds in the dividend strategic-beta group was just 18.3%. Another example was the outperformance of the growth factor against the value factor for Asia ex-Japan equity, which appeared to explain the high success rate in the growth strategic-beta group and the low success rate in the value strategic-beta group. However, investors should be cognizant that the Asia-Pacific markets are a mixed bag. Each market may have seen different factors perform quite differently, as illustrated in Exhibit 6.
Due Diligence Is Key
Factors can be fickle. Given that it is difficult and maybe even impossible to time factors, investors should focus on the permanent features of these products when conducting due diligence. The most important input into this analysis is the construction of the indexes that underpin these products. Seemingly small and nuanced differences in index construction can yield materially different outcomes.
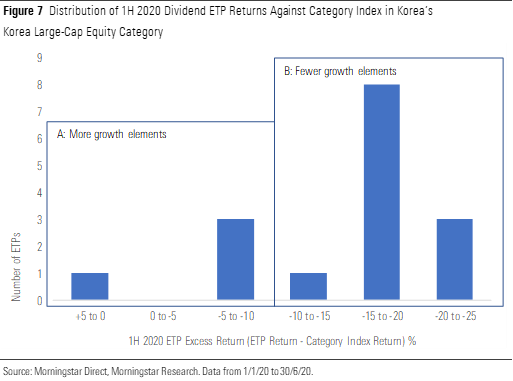
Exhibit 7 shows the performance distribution of the dividend ETPs in the Korea large-cap equity category. The dividend category housed the largest number of strategic-beta ETPs in the Asia-Pacific region as of the end of June 2020, of which 16 were dividend ETPs. The distribution of these funds' performance shows some extreme results in excess returns against the category index (the Morningstar Korea Large Cap Index). These products can be roughly grouped into two cohorts. Group A had higher excess returns (positive 5% to negative 10%) relative to Group B, which had excess returns ranging from negative 10% to negative 25%.
Upon further examination, three of the ETPs in Group A track a dividend index that also requires some element of growth, such as growing dividend per share and earnings per share growth. The remainder have the Kosdaq market as their selection universe (a market for small and midsize enterprises and IT companies). The stocks that make up the Kosdaq tend to tilt further into the growth segment of the Morningstar Style Box. As they lean toward growth, these stocks tend to have lower dividend yields. The ETPs in Group B, on the other hand, generally track indexes that select stocks from the broader Korea Composite Stock Price Index. As such, they don't have the same growth orientation as those from Group A. When we examined the factor profiles of the South Korean growth and value indices, the growth index exhibited a higher-quality tilt than the value counterpart.
Strategic-beta ETPs' performance through the first six months of 2020 underscores the need for thorough due diligence when selecting these funds. These products' names never tell the full story. The nuances of index construction can result in very different factor exposures for the overall portfolio and hence can drive very different investment results.


.png)


