


In our latest Diversification Landscape report, we took a deep dive into how different asset classes performed in the past couple of years, how correlations between them have changed, and what those changes mean for investors and financial advisors trying to build well-diversified portfolios.
Now that inflation has been running well above average for nearly two years, we also looked at how a continued period of higher inflation might affect the link between stocks and bonds. The upshot: If inflation remains above average for an extended period, Treasuries and other high-quality bonds might be less reliable diversifiers, although they still have merit as core portfolio holdings.
Learning From History
The resurgence in inflation that started in May 2021 made market conditions much more challenging. Supply chain disruptions, a tight labor market, the war in Ukraine, and strong economic growth all conspired to push up inflation from its previously benign levels. The year-over-year change in consumer prices rose to more than 7% by the end of 2021 and reached as high as 9% by mid-2022. Inflationary pressures have been easing a bit in the first few months of 2023, but inflation was still running well above average at the end of 2022.
Higher inflation marked a sharp reversal from the previous regime. For most of the previous 30 years, conditions were unusually benign from an inflation perspective. Aside from a brief increase in the mid-2000s, inflation had generally been running well below its long-term historical average of about 2.7%. Cooler-than-average inflation, in turn, created close to ideal conditions for stock/bond correlations. With inflation mostly a nonissue, stocks and bonds moved largely independently; in fact, rolling three-year correlations between stocks and bonds were consistently negative (or barely above zero) from November 2000 through 2020.
With those conditions now a distant memory, it shouldn’t come as a surprise that correlations between stocks and bonds have sharply increased. In fact, correlations between stocks and bonds edged into positive territory in 2021, with a correlation coefficient of 0.09 between the two asset classes for the full year. Stock/bond correlations trended up to 0.58 for the full year in 2022, and 0.15 for the trailing three-year period.
The recent uptrend in correlations has been unusually dramatic but not unprecedented. As shown in the graph below, stock/bond correlations has often been positive over multiyear periods. For example, the trailing three-year correlation coefficients between the two asset classes in the U.S. were consistently above zero from August 1966 through August 1974. Stock/bond correlations were also consistently positive from October 1974 until late 2000.

We also looked at correlations over specific periods of higher inflation, generally defined as periods when year-over-year inflation increased by at least 5% and remained high for at least six months.[1]
As shown in the table below, correlations between stocks and bonds increased during some but not all periods. In general, correlations increased the most during periods when inflation was both high (in the double digits) and protracted (lasting at least three years). The post-World War II era saw an unusually high spike in inflation (driven by the removal of wartime wage and price controls, combined with large numbers of troops coming home), but the increase in consumer prices lasted only about a year. More recently, surging economic growth in China fueled rising consumer prices in 2007 and 2008, but inflation remained below 6% and lasted less than a year.
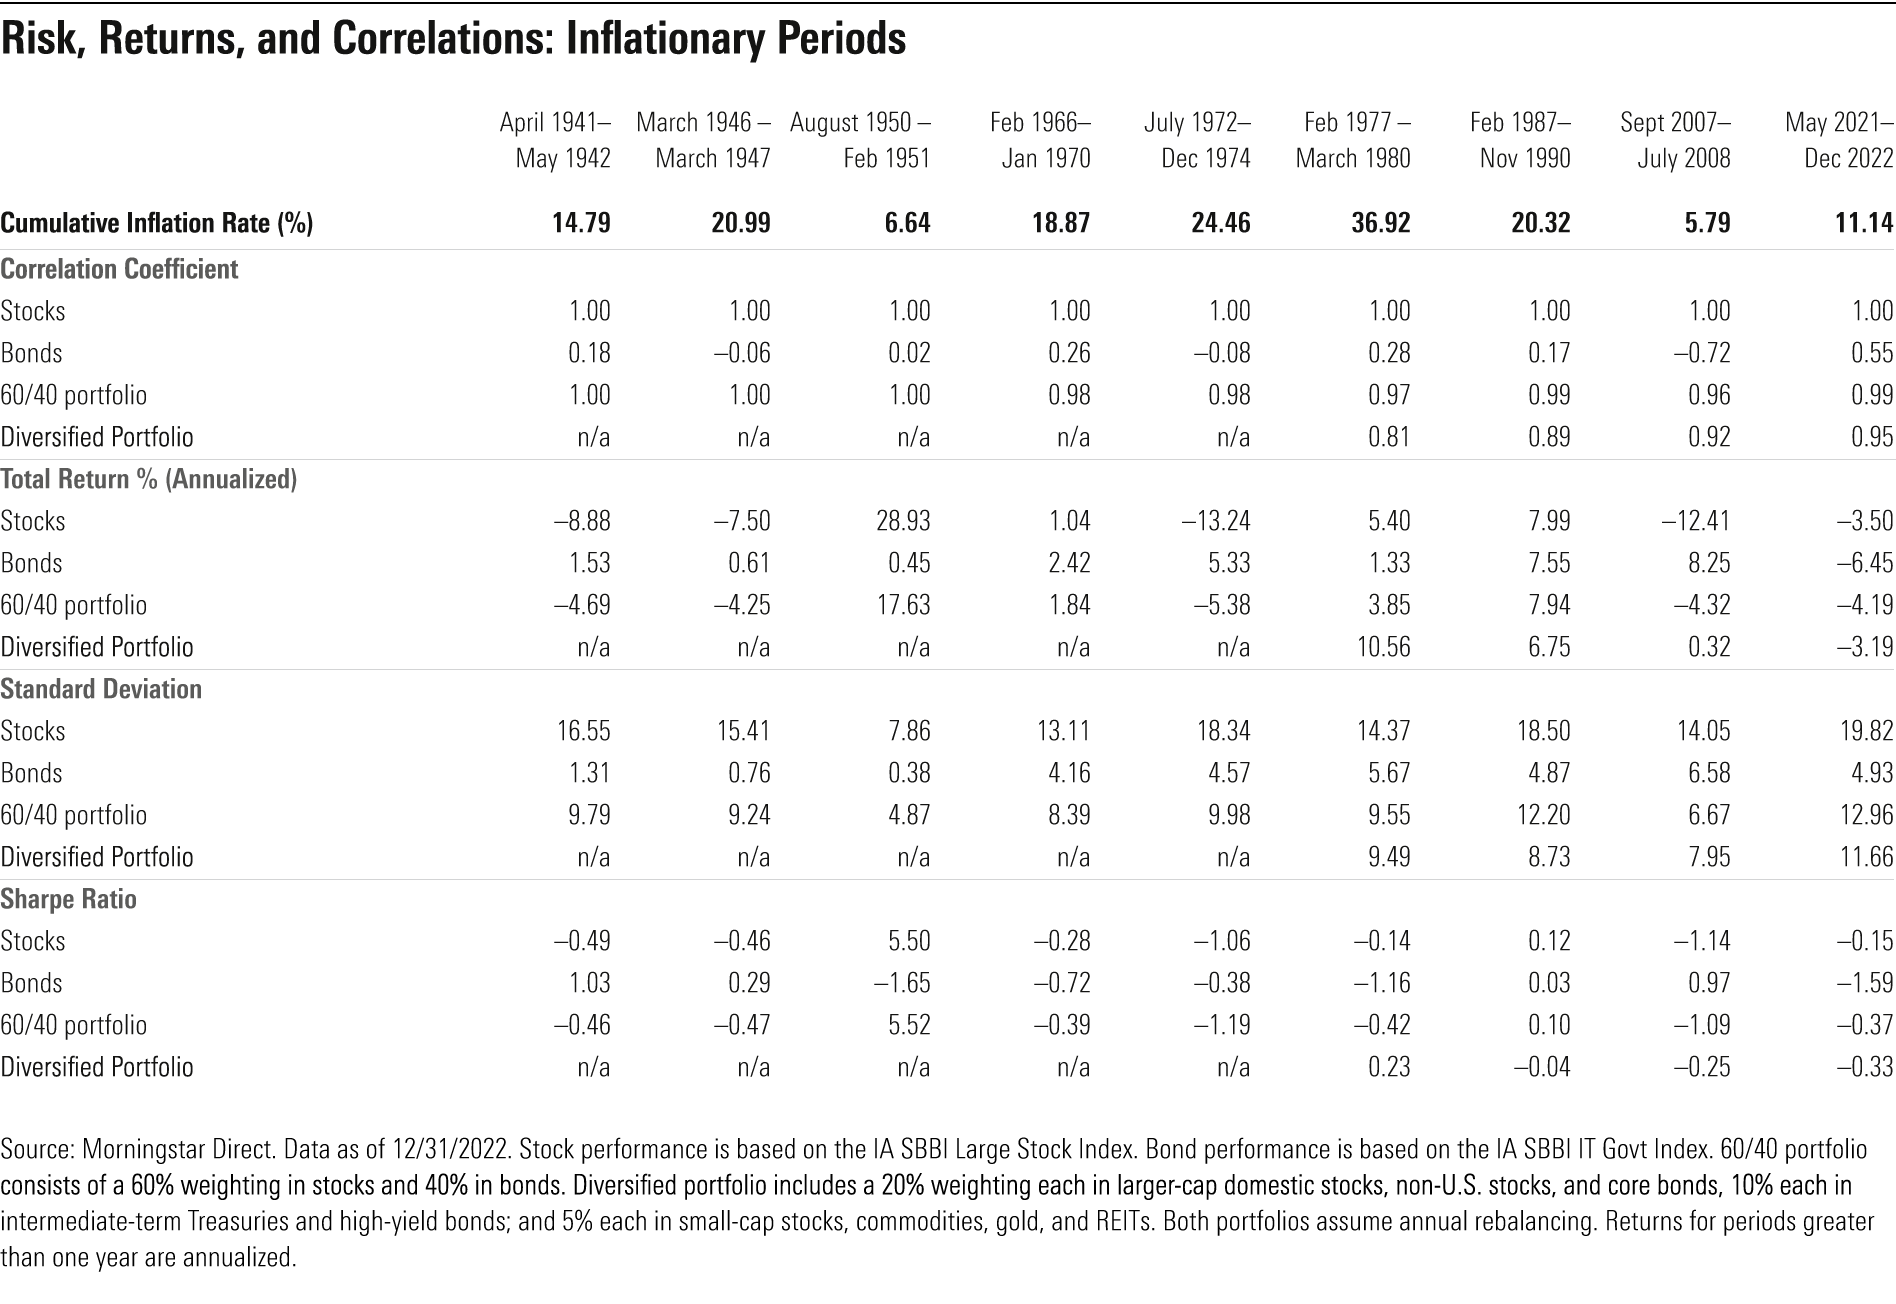
The most dramatic correlation upturns took place in the periods from February 1966 through January 1970 (driven by low unemployment and surging economic growth) and February 1977 through March 1980 (driven by soaring oil prices, the oil embargo and related price shocks, and expansionary monetary policies). Correlations ended up in a similar range (0.26 and 0.28, respectively) in both periods.
Portfolio Implications
There are a couple of key lessons to draw from these patterns. For one, the environment for both inflation and interest rates has fundamentally changed. Thus, while adding bonds was previously an easy way to reduce risk and improve portfolio diversification, that is no longer the case. As long as the outlook for inflation and interest rates remains uncertain, the diversification benefit from bonds will probably remain muted.
That doesn’t necessarily mean investors should shift assets to stocks from bonds, however. Stocks and bonds tend to move more in tandem during inflationary periods, but bonds can still provide significant diversification benefits as well as play a critical role in providing ballast and reducing risk at the portfolio level.
[1] Inflationary periods are based on the parameters described in Neville, H., Draaisma, T., Funnell, B., Harvey, C.R., & Van Hemert, O. 2021. “The Best Strategies for Inflationary Times.” https://ssrn.com/abstract=3813202.
This article originally appeared on Morningstar.com and has been slightly modified for an Asian audience


.png)


