


Emerging from one of the worst years in recent history, the U.S. equity market has steadily climbed higher in 2023 despite a gloomy growth outlook according to some pundits.
Canadian investors looking for exposure to the U.S. stock market can turn to straightforward and inexpensive passive index funds, whether as a buy-and-hold investment or a more tactical allocation. While the array of available indexes (and funds tracking them) might seem nearly identical, not all benchmarks share the same breadth and approach to which stocks they let in and those they leave out.
This article explores the differences among indexes underpinning Canadian-listed ETFs that track the U.S. equity market. U.S.-listed equity ETFs’ average fees are lower than their Canadian-listed counterparts, but currency conversion and brokerage fees are additional variables to consider.
The Menu
Exhibit 1 summarizes some of the key dimensions along which indexes differentiate themselves. Given that all the benchmarks featured here weight stocks by market capitalization, the differences between them relate to security selection and portfolio maintenance.
Exhibit 1: Broad-market Indexes Composition Rules
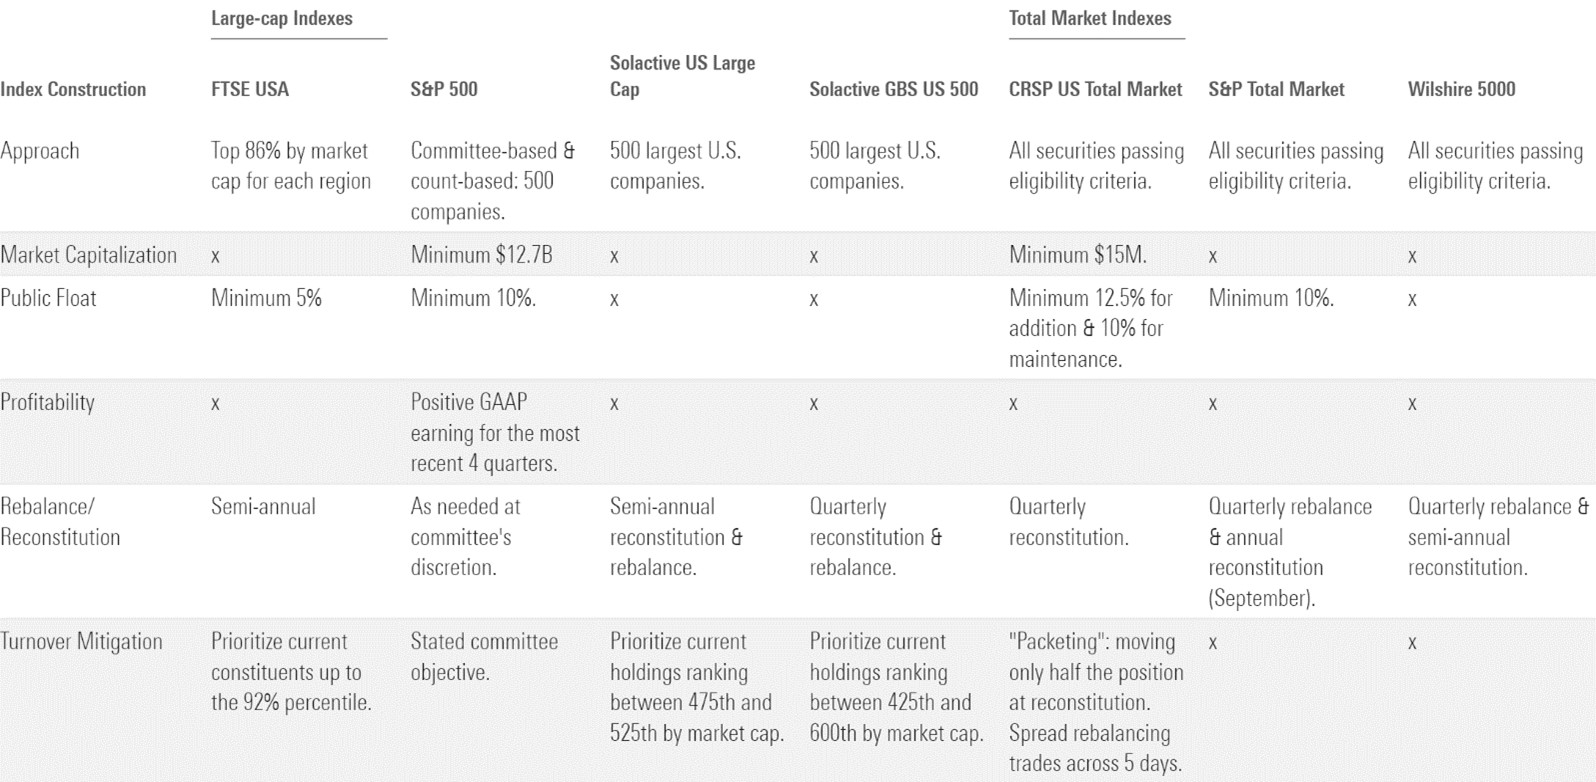
Source: Index methodology documents. Data as of June 2023.
Picking Stocks
The indexes featured here all have broad reach but vary on how much of the U.S. market’s investable market capitalization they hold. Some are limited to large- and mid-cap stocks, which accounts for around 80-85% of the U.S. market cap. Total market indexes aim to hold 98-100% of the investable market by including small- and micro-cap stocks. Reaching further down the market-cap ladder more completely captures the opportunity set and further diversifies firm-specific risk in the portfolio. However, including these smaller companies can also result in higher risk and transaction costs as these stocks are less liquid and more volatile.
Index inclusion criteria varies among these indexes, especially among the large-cap-focused ones. These benchmarks use rankings, counts, or a percentage of market cap to establish thresholds that define the market-cap segment they intend to capture. For example, the FTSE USA Index sweeps in as many stocks as needed to represent the top 86% of the total investable market. By comparison, the Solactive US Large Cap Index is strictly count based—it owns the 500 largest U.S. stocks. The FTSE USA Index and the Solactive US Large Cap Index have about 480 common holdings, most of which are mega- to large-cap companies. The 100-plus names unique to the FTSE USA Index are smaller positions that fill out the percentage of market-cap requirement and often have a minor effect on the index’s performance.
The S&P 500 is a special case. Despite being count-based, the index leaves some discretion to a committee which selects eligible stocks. The portfolio generally tallies right around 500 companies. But the index’s constituents are not necessarily the largest 500 U.S. companies by market capitalization. As a result, the S&P 500 and the Solactive US Large Cap Index – which both target 500 of the largest U.S. stocks – have roughly 50 different holdings that can cause marginal differences in performance.
Regular Maintenance
The turnover on broad, market-cap-weighted indexes tends to be low – typically less than 5% per year. But portfolio managers tracking these indexes still incur trading costs that detract from returns. As the amount of money following these indexes has grown, index providers have developed measures to mitigate turnover and the costs stemming from the market impact of their trading around regular index rebalancing and reconstitution.
Most large-cap indexes use buffers at the bottom of the portfolio to minimize unnecessary trading from adding and removing companies from the portfolio based on small changes to market cap ranking. Most of the rank- or count-based indexes keep existing constituents in the portfolio until they cross a certain threshold beyond the lower bound of the selection criteria. CRSP further curbs this issue by using a “packeting” approach, which moves only half of a borderline position in or out of the benchmark at any given reconstitution. Meanwhile, the committee-driven S&P 500 explicitly states that its curators aim to avoid unnecessary turnover.
Naturally, total market indexes tend to be less impacted by turnover as they aim to hold the entire investable market, leading to fewer constituent changes. Yet even the broadest benchmarks must be mindful not to move the market against them when they trade. CRSP, for instance, spreads rebalancing trades over a 5-day period, lessening the impact of its quarterly index changes.
The Tesla Case
The case of Tesla helps to illustrate these differences in greater detail. Tesla’s market capitalization stood at $4.3 billion at the end of January 2013. This was above the minimum market capitalization of $4 billion required by the S&P 500 at the time, and the company has continued to stay above the index’s size threshold since. Yet, the index committee did not add Tesla to the index until December 2020, after the firm met its profitability criteria earlier in the year.
Tesla found its way into other benchmarks well before 2020. The FTSE USA Index added Tesla in March 2014. The Solactive US Large Cap Index included Tesla in its lineup shortly after its launch in November 2018, well before Tesla’s meteoric rise in 2020. The Solactive GBS US 500 Index was late to the party given its launch in early 2020, but funds tracking this index still enjoyed much of Tesla’s outperformance in 2020. Unlike the S&P 500, none of these indexes has a profitability requirement for new names. Tesla’s timeline extends further when we consider total market indexes. The S&P Total Market, CRSP U.S. Total Market and Wilshire 5000 Total Market indexes added Tesla in June 2010, December 2011 and January 2011, respectively.
The table below shows Tesla's market cap and price/sales multiple when it was added to each index. Compared to its peers, the S&P 500 and the trillions of assets tied to it got the bad end of the bargain. It’s clear that the wider the net, the sooner an index will include nascent companies and the lesser chance investors will miss out on investment opportunities.
Exhibit 2: Tesla Addition Timeline
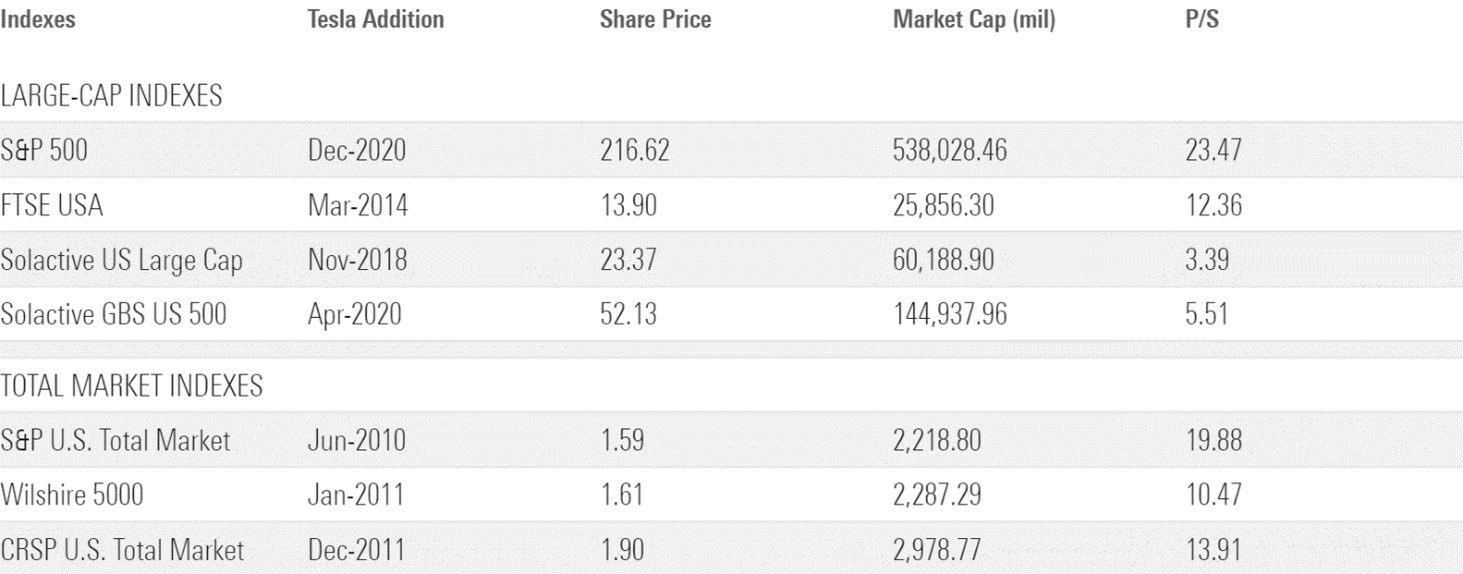
Source: Morningstar Direct.
But this isn’t an indictment of the S&P 500. During the early 2020 COVID-19 shock, the index held up as well as its large-cap peers and better than its total market peers, thanks in part to its profitability screen and large-cap focus. That said, excluding Tesla for most of the subsequent recovery phase hurt its relative performance. Leaving out small-cap stocks—which rebounded sharply off the market’s March 2020 bottom—also left large-cap-focused indexes like the S&P 500 at a disadvantage.
Exhibit 3: COVID-19 Performance of Major Indexes
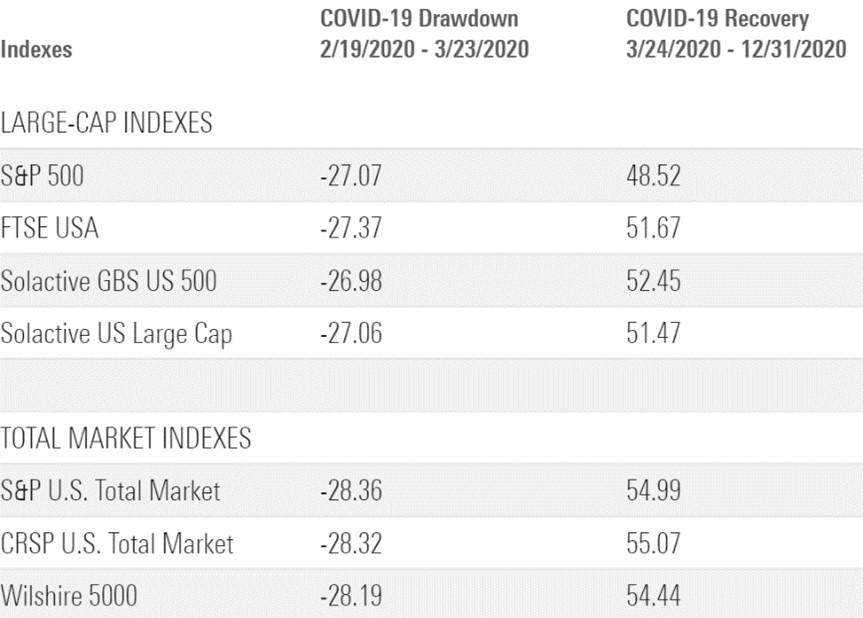
Source: Morningstar Direct.
Neither Standard, nor Poor
Short-term deviations help explain the past, but investors should stay focused on the future. Varying index criteria can leave the door open for curious differences in indexes’ composition, but the long-term performance of these cap-weighted indexes turned out to be fairly similar. Their biggest constituents – the main drivers of their returns – often overlap significantly.
Investors looking for exposure to U.S. equity can still comfortably pick up an index fund tracking the S&P 500 but understand why it might not hold certain rising stars in the market. Overall, any broadly diversified index fund stands a good chance of delivering great long-term results, regardless of differences around the edges.
According to our semi-annual Morningstar Active/Passive Barometer report that looks at the performance of U.S. funds, only 34% of active Large Blend funds outperformed their average passive peer during 2020. Though the figure climbed higher in 2022, the success rate still barely came out ahead at 54%. Proponents of active management often argue that they are better poised to capitalize on volatile market conditions than their indexed peers, yet active funds did not pass the test during some of the rockiest markets we have seen in a while. And active funds’ success rates dwindle as we lengthen the time horizon. Over the 20 years ending December 2022, just 13% of active funds in the large blend category survived and outperformed their average passive peer.
There is no secret recipe here. Index funds’ razor-thin expense ratios have long been the main source of their outperformance. Their broad diversification ensures that investors have a stake in the market’s winners and mitigates the impact of owning losers. Low turnover enhances tax efficiency and keeps trading costs under wraps. While these funds will never offer the highest returns, they have consistently done better than the majority of their peers. It’s worth noting that Canadian-listed funds often carry higher expense ratios than their U.S.-listed counterparts, particularly older mutual funds. While certain providers might be more familiar to Canadian investors than others, thorough manager due diligence can reveal equally well-managed funds with lower fees.
Exhibit 4: Canadian-listed Index-Tracking Funds Roster
![]()


.png)


