


Back in the day, wrote baseball analyst Bill James, teams would routinely invite players who hit 35 home runs during their minor league seasons to the next year's major league training.
Naturally, they would be less successful against stronger opposition, but if they could hit 20 home runs in the show, that would be good enough. Those prospects were worth a look.
One season, reported James, a Texas Leaguer named Ken Guettler clouted 62 home runs. His organisation subsequently ignored him. According to James, that occurred because Guettler's feat baffled them. So, they simply shook their collective heads and moved on.
Such has been the performance of US equities. Their long-term total returns are mind-boggling. For example, a $1 investment made on New Year’s Day 1946 in the companies held by the Ibbotson Associates Large-Company US Stock Index would today be worth $3,514 (£2,781)!
Admittedly, those results include an unhealthy dollop of inflation. In 1946, that $3,514 could have financed a 20% down payment on a typically priced house, four years of tuition at Harvard, and a new car. Today, those same expenditures would cost more than $350,000.
Even after adjusting for rising costs, the return on US equities has been remarkable. In real terms, that hypothetical $1 investment would have grown to $208. To be sure, 78 years is a long time to wait. But earning more than 200 times one's purchase price while doing nothing is a terrific deal.
What Are The Real-Terms Results?
That display, it should be granted, is somewhat misleading. When depicting returns that have compounded over long periods, conventional graphs exaggerate the effect of recent events, because the distance from the starting point of $1 to $100 is (almost) the same as from $100 to $200. But of course, the initial accomplishment is much greater.
Measuring equities' performances properly, by considering percentage rather than dollar gains, improves the tale. By that account, stocks have advanced quite steadily. Equity prices climbed for 20 years, caught their breath over the next 15, rose for two decades, retrenched during the early 2000s, and have rallied ever since. Whatever has propelled stocks has done so throughout the 75-year period.
Presumably, the cause of equities' success has been the growth of corporate earnings. After all, today’s companies are far larger than their predecessors. When General Motors [GM] earned $800 million in 1955, it was by a wide margin the nation’s most profitable business. In contrast, Apple [AAPL] generated almost $100 billion in net income in its fiscal year 2022.
The next chart plots the numbers, depicting the trailing 12-month aggregate earnings of the S&P 500's constituents since 1946, once again expressed in real terms.
This time, I used a log scale, which eliminates the compounding effect by portraying all equally-sized percentage gains as equally-sized distances on the chart. (The shaded areas represent periods of high inflation; you can ignore those, as they are irrelevant to this discussion.)
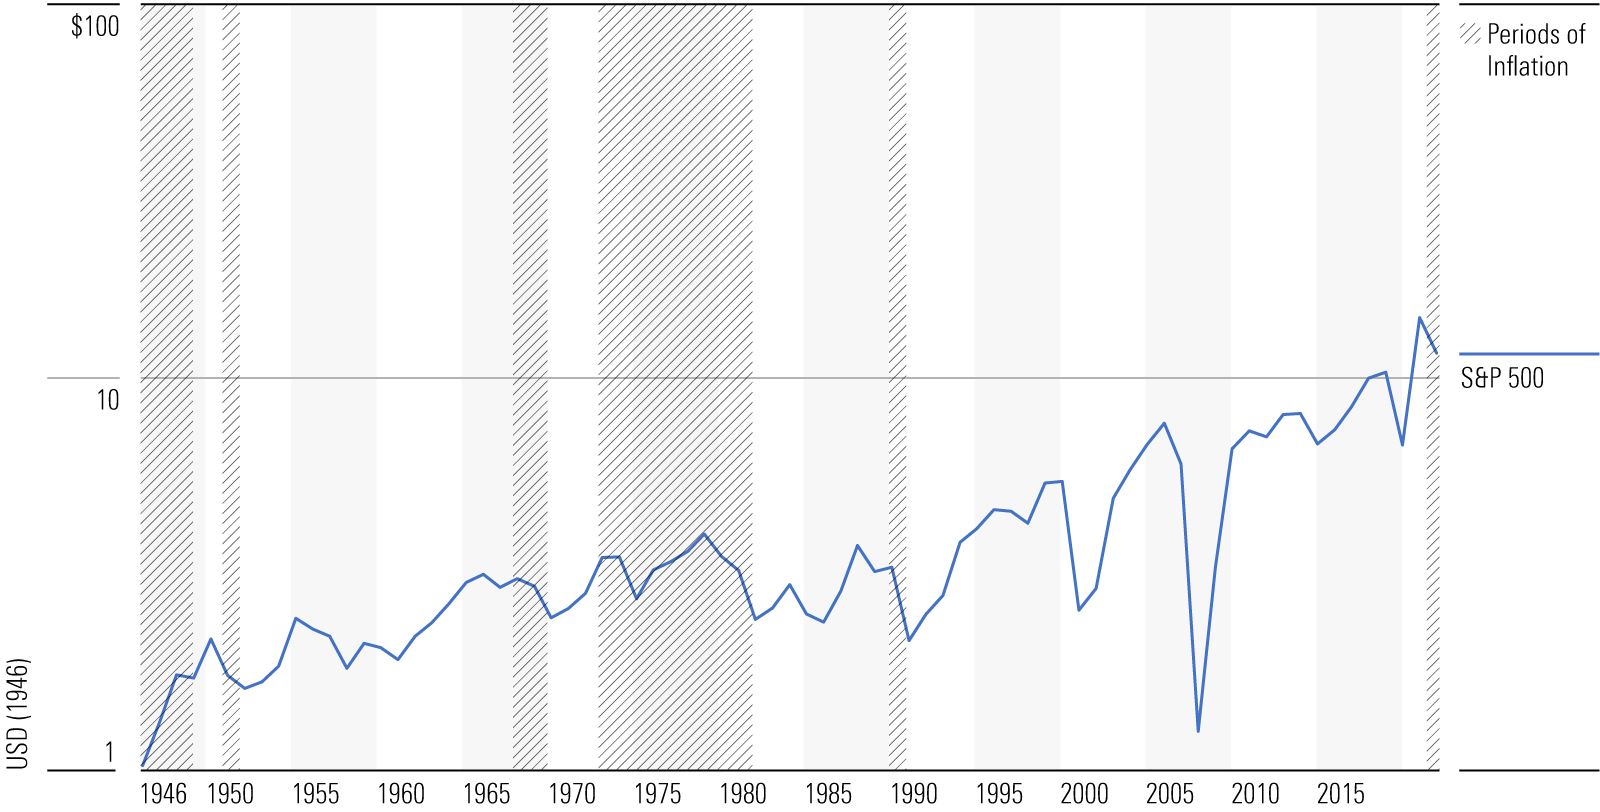
The diagram leads to three conclusions. First, although more volatile, real corporate earnings have behaved much like stock returns. They, too, have alternately increased and then retrenched, with the advances typically lasting longer than the slumps. Three steps forward, one step back.
Second, the damage from 2008′s global financial crisis was unprecedented by post-1945 standards.
Third, the increase in after-inflation corporate earnings accounts for only part of equities' total returns. While stocks are worth 208 times their original investment, real corporate earnings have increased only 11-fold.
The gap appears smaller when those figures are annualised: Equities have gained just over 7% per year (as always for this column, in inflation-adjusted terms), while corporate earnings growth has been 3%. Still, that leaves 4 percentage points unexplained.
P/E Ratios and Dividends
One factor is investors now prize stocks more highly than in the past, as indicated by their steeper price-to-earnings (P/E) ratios. However, changing valuations have not been a major component of equities' success. In 1946, reports professor Robert Shiller, the S&P 500's constituents sold at 15 times current earnings. Now, they cost 24 times earnings. The difference has added only about half a percentage point annually to equity returns.
The main contributor has been dividends. Critically, companies have achieved their 3% annualised real earnings growth without reinvesting all their profits. Historically, they retained only half their earnings. The other half has been distributed to shareholders, thereby greatly boosting stocks' returns. The after-inflation math has been 3% real earnings growth plus 3.5% dividends plus 0.5% higher P/E ratios.
(Note: Although the stock market’s current dividend rate looks low by historical standards, at 1.4%, it is within its normal range. For tax reasons, companies now spend more on stock-buybacks than on dividend payouts. But the effect is similar: those assets are spent – directly with dividends and indirectly with stock buybacks – on shareholders rather than reinvested into the businesses.)
Can The US Continue to Do Well?
This framework permits a rough guess at US stocks' long-term future. In recent decades, real earnings growth has surpassed earlier standards, averaging roughly 4% per year. I will assume that increase is temporary, reflecting the effect of tighter corporate management caused by widespread adoption of the doctrine of shareholder value. Today's businesses are run more strictly than in the past.
In fact, as real corporate earnings growth historically has tracked real gross domestic product (GDP) growth, and annualised GDP growth has slowed to 2% in this millennium, I will shave the earnings growth estimate to that level.
Finally, the current stock market P/E ratio seems about right. Yes, it is higher than that of 1946, but equities have become more of a mainstream investment since that time. Consequently, the price that investors will pay for their earnings has increased. Barring a resurgence of inflation, a P/E ratio of 24 seems viable.
By my count, stocks figure to make an annualised real total return of 5.5% over the long haul: 2% for earnings growth and 3.5% for dividends or share buybacks. If so, the comparison with Guettler would no longer be apt, as equity returns would become imaginable. They would, however, remain highly attractive. That still sounds like a home run.


.png)


